The Pair Matcher
Picking good pairs can be a very time consuming task. We developed this product to save the countless hours of looking through charts to verify good pairs. This stock pair picking program will scan all the combinations of symbols in most any given list of stocks.
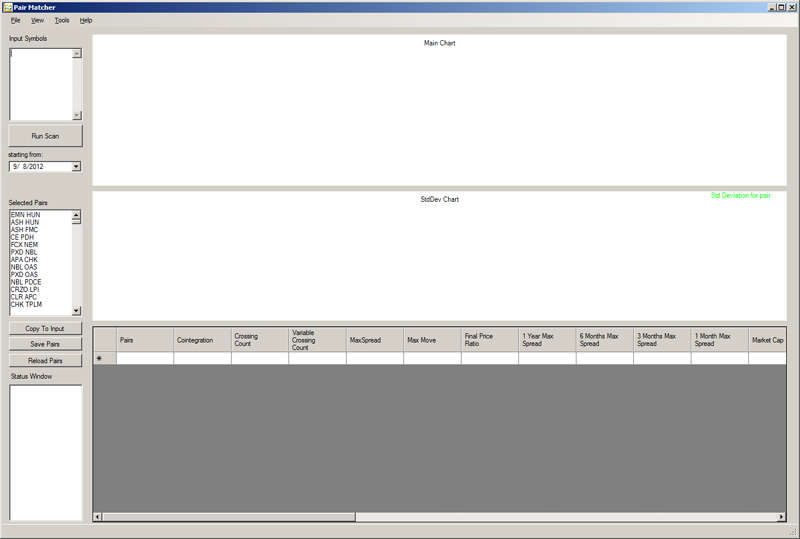
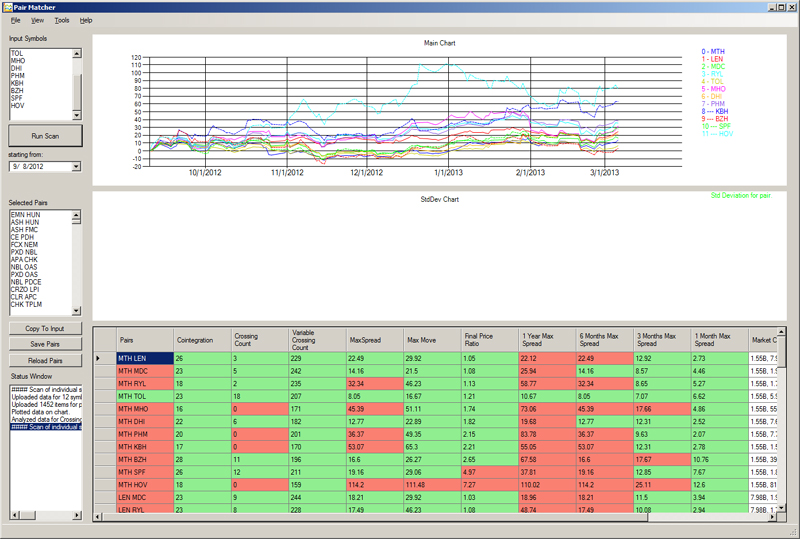
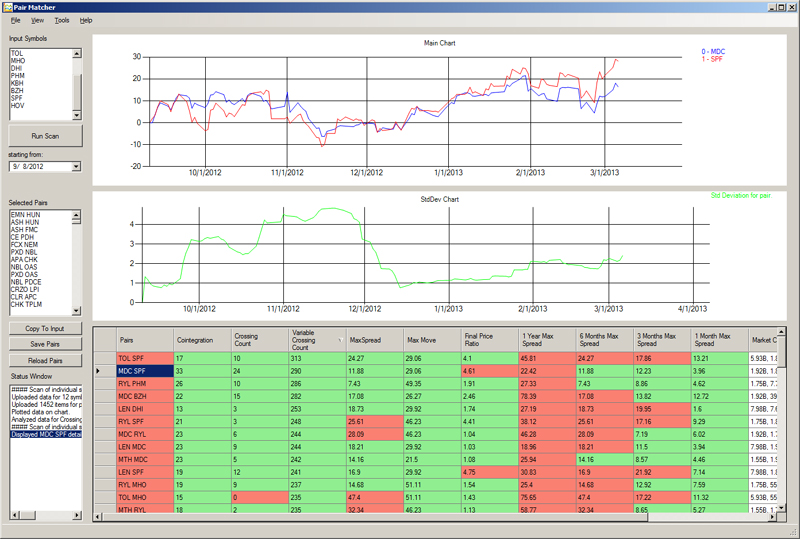
To scan a new sector you copy your symbols into the “Input Symbols” window. When you click “Run Scan”, the pairs program will compare every stock in your list against each other and output the results to the spreadsheet below. The Pair Matcher defaults to 6 months back from today. When you click the run scan it will download the data or update the data files if you have already downloaded a specific symbol. We have tested up to 300 individual symbols in this window. It is not recommended to put more than that amount since the download will take some time, not to mention that the amount of combinations will be in the 100′s of millions! After you click the run scan button your screen should look like the following.
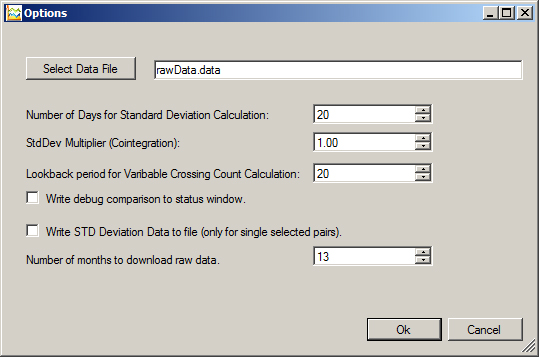
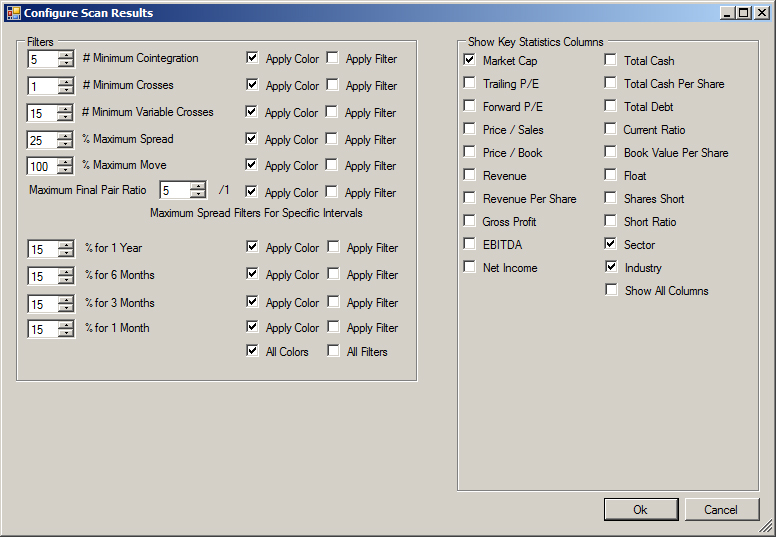
In this screen you will be able to sort by any column, it also shows a snapshot of the symbols you have scanned in the main chart window. This gives you the ability to look at a glance if the sector you are viewing will make a good pairs sector. You are also able to change the results with filters, highlighting and options for the look back period of your standard deviation calculation in the Variable Crossing count. The cointegration look back period and the multiple of the standard deviation you would like to calculate the pullbacks in the cointegration calculation are also adjustable. The following are screen shots of the Options and Filters screens.
We have also added the ability to see fundamental data for your pairs. If you have enabled any of the apply color options, the results will be color coded with green meeting the criteria and red not meeting the criteria. If you apply the filter then the program will not display any pair that does not meet those specific criteria. The main reason we created this program was for the following window. You get to this window by either double clicking on a stock pair or highlighting the pair and hitting the “space bar”.
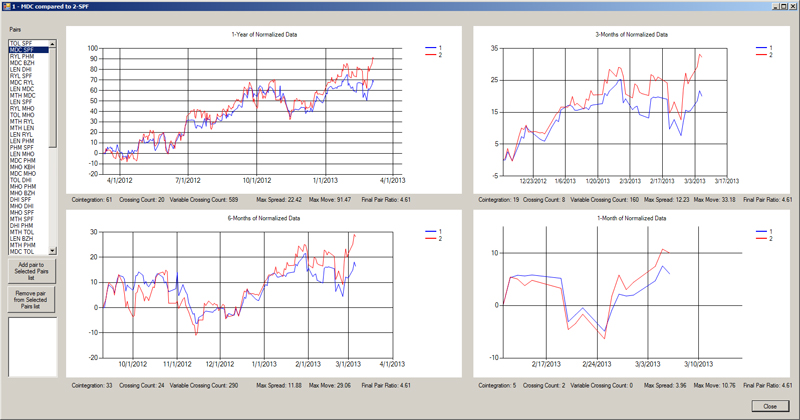
This 4 charts window is setup so that you can see at a glance if this pair will make a good pair. You are able to use the arrow keys in the Pairs window to quickly go through your pairs. You can then use the “Insert” or “Delete” keys to add or delete the pair from your “Selected Pairs” window in the main screen of the Pair Matcher. You also have the ability to zoom in on any window. This window displays the pair in 4 time periods, 1 year, 6, 3, and 1 months. Under each of those windows it also displays the cointegration, crossing count, variable crossing count, max spread, max move and the pair ratio.
The Pair Matcher also has the ability to edit a list of pairs that you have selected or would just like to scan. Enter your pairs list into the Selected Pairs window, click on Copy to Input and then click “Run Scan”. It will download your data for you and then run the scan. You also have the ability to add and remove pairs from your “Selected Pairs” window. In the scan results window, use the up and down arrow keys to scroll through your pairs. You can hit the “space” bar to pull up the 4 chart window. Then either hit “A” for add or “D” for delete.
In this main window you also have the ability to look at the specific time frame you have selected in the “starting from” box. The main chart will display that individual pair you have clicked on along with a chart of the standard deviation.
DISCLAIMER
U.S. Government Required Disclaimer – Futures, options and Stock trading has large potential rewards, but also large potential risks. You must be aware of the risks and be willing to accept them in order to invest in futures, options and stocks. Don’t trade with money you can’t afford to lose. This website is neither a solicitation or an offer to buy/sell futures, stocks or options. No representation is being made that any account or software subscription will or is likely to achieve profits or losses similar to anything discussed or mentioned in our videos or website. The past performance of any trading system or methodology is not necessarily indicative of future results.

